
Share
![]()
min read

Senior Content Manager
Content specialist in office design and build.
-
London’s office market is shifting again, with rising rents, tighter supply and growing competition for the best-quality space. Many businesses are still refining their workplace strategies after years of hybrid experimentation, while upcoming energy regulations are reshaping the supply of buildings available to rent. Against this backdrop, many businesses are facing the challenge of understanding which spaces offer genuine long-term value and align with their needs both now and in the future.
This article breaks down what you can expect to pay for office space in London in 2026, why costs are rising, and how to plan your property strategy with confidence. Below, you can jump straight to any section that’s most relevant to your search.
-
London office market overview for 2026
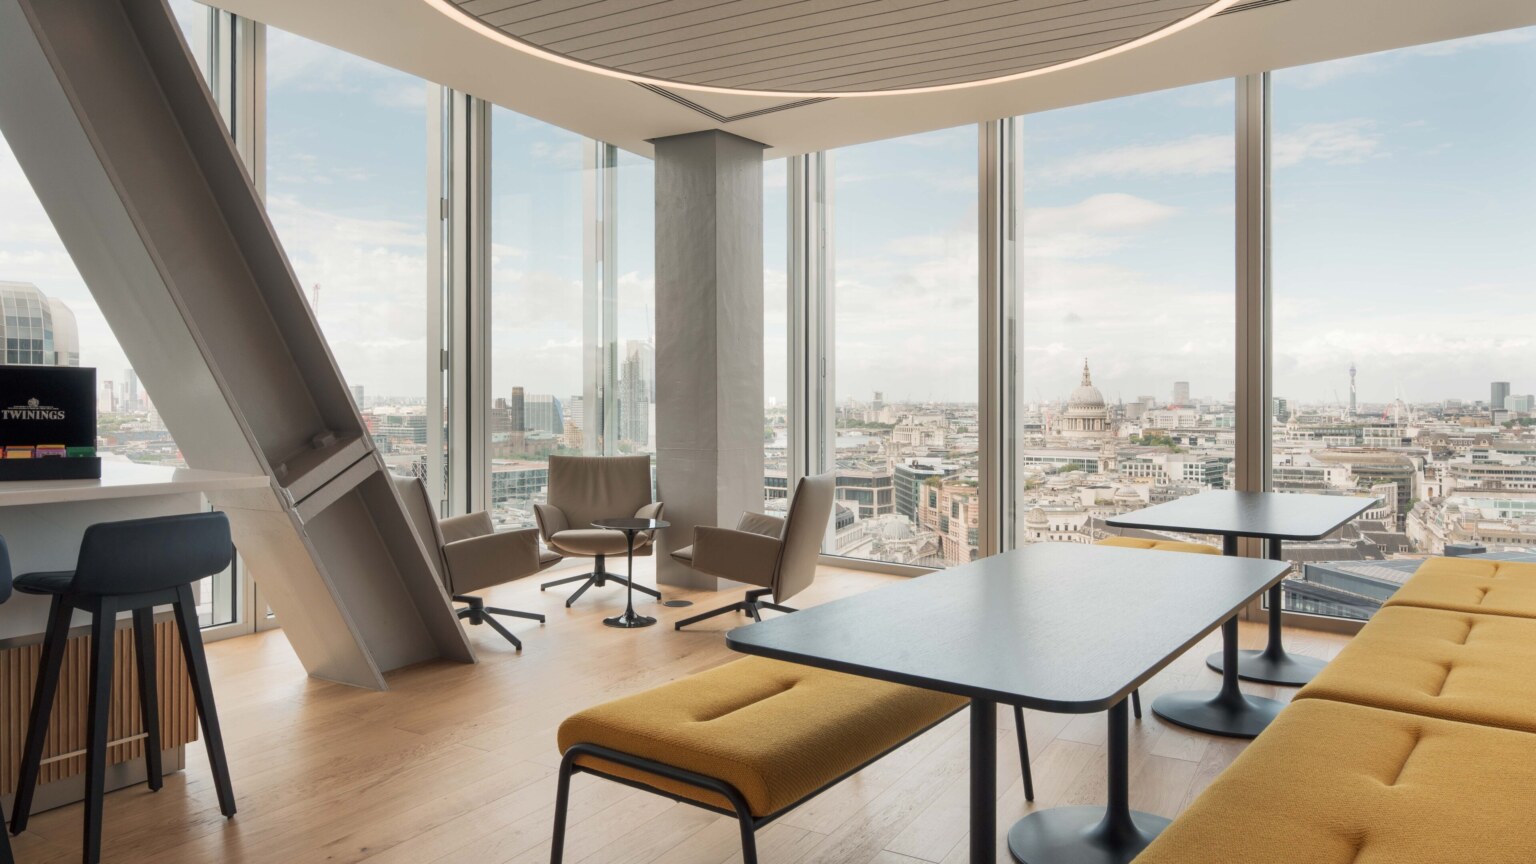
The market is starting 2026 with a level of urgency we haven’t seen for several years. After a strong year of leasing activity in 2025, many occupiers are moving quickly to secure high‑quality space before supply tightens further. Prime rents have reached new highs across the capital, fuelled by the shortage of best‑in‑class buildings and the growing expectation that offices should support hybrid working, talent attraction and ESG goals.
-
Recent market data shows just how competitive things have become. In the West End, prime rents are now approaching £182.50 per sq ft, while the City core is holding at around £100 per sq ft. Southbank sits close to £90 per sq ft, with refurbished space performing almost as well as new builds. Around 68% of all take‑up in the past 12 months has been in new or comprehensively refurbished stock – a clear sign that businesses are prioritising energy performance, layout flexibility and employee experience.
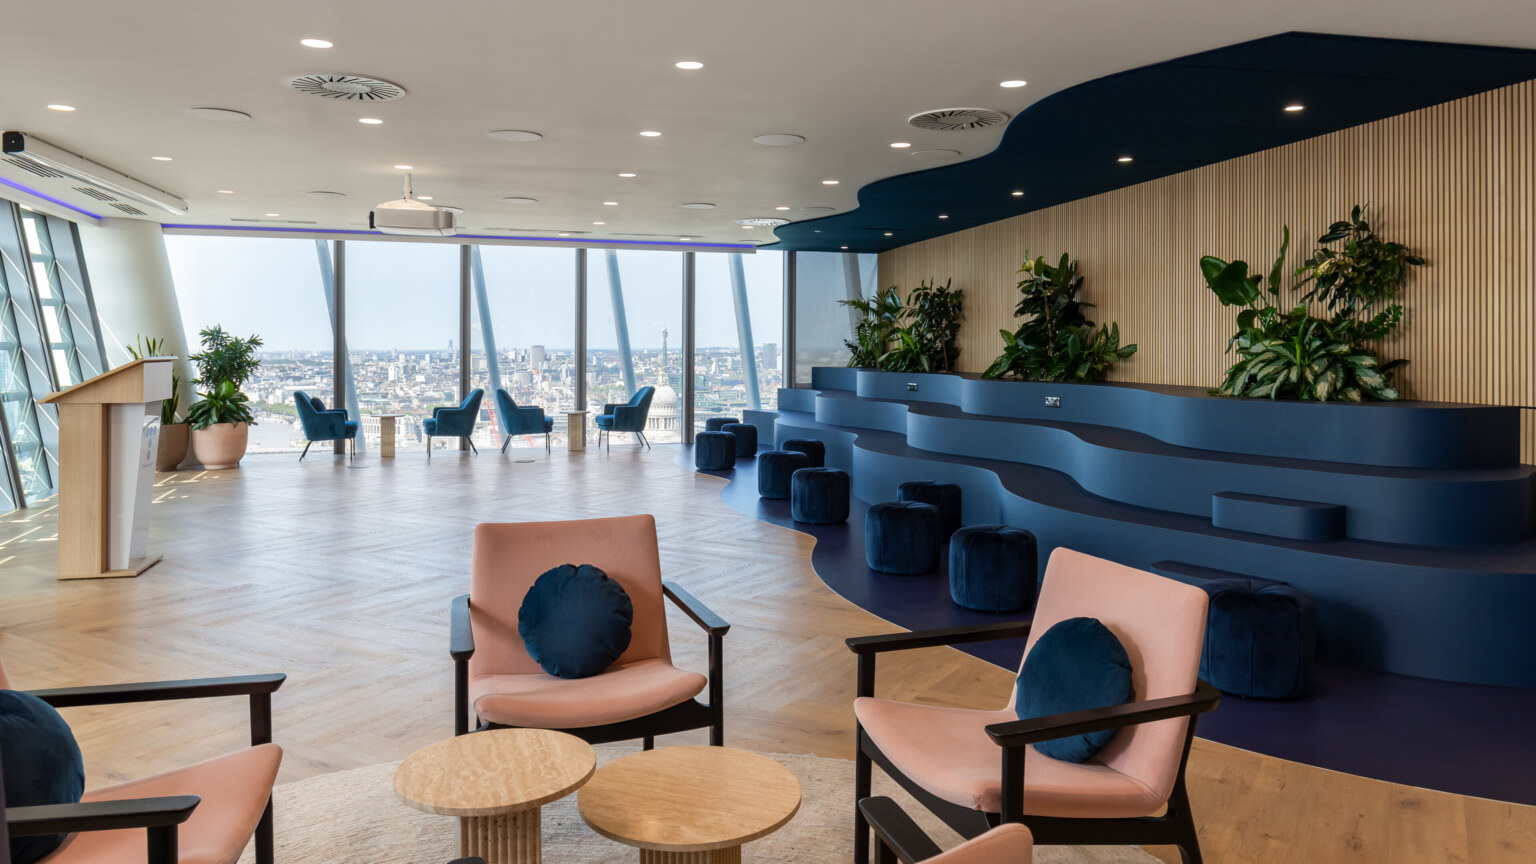
The wider picture is one of right‑sizing rather than retreat. Footprints are becoming smaller, but demand for quality is intensifying. Offices are expected to work harder: supporting collaboration, enabling focus work, and acting as a cultural anchor for teams who no longer spend five days a week on site. These expectations are shaping both rent levels and the pace of decision‑making as we move into 2026.
-


-
Prime rent in London
Prime rents have risen across London as businesses compete for the limited supply of high‑quality space. The clearest example is the West End, where demand for best‑in‑class buildings has pushed prime rents to around £182.50 per sq ft – a 14% year-on-year rise. Availability is particularly tight in areas like Mayfair and St James’s, and we’re seeing some ultra‑prime floors exceed these levels when they offer exceptional views, amenities or sustainability credentials.
The City core is experiencing a similar story, though at a different price point. Prime rents are holding at roughly £100 per sq ft, with premium tower floors achieving £115 or more. These buildings often benefit from larger, more flexible floorplates and strong transport links – a combination that continues to draw professional services and financial occupiers.
Southbank and Midtown remain competitive alternatives, with many refurbished buildings reaching close to £90 per sq ft. These areas appeal to occupiers looking for strong connectivity and a more creative or campus‑style environment, particularly where landlords have invested heavily in modern amenities and ESG performance.
Further east, in markets like Shoreditch, Farringdon and Old Street, refurbished space is performing almost as strongly as new builds. Headline rents in these locations typically sit between £90–£100 per sq ft for best‑in‑class space. The continued appeal of these submarkets reflects how workplace experience, connectivity and character now carry as much weight as brand‑new construction.
-
The cost of office space in London in 2026
Borough Grade A Rent (per sq ft) Grade B Rent (per sq ft) Knightsbridge £97.50 - £110 £70 - £90 Hammersmith & White City £55 - £65 £40 - £50 Victoria £90 - £95 £65 - £75 Paddington £80 - £90 £65 - £75 Chiswick £45 - £55 £35 - £45 St. James’s & Mayfair £130 - £182.50 £85 - £115 Covent Garden £85 - £95 £65 - £80 Soho £95 - £115 £70 - £85 North Oxford Street (East & West) £80 - £95 £65 - £77.50 Midtown £70 - £85 £50 - £67.50 Holborn & Bloomsbury £75 - £90 £65 - £72.50 London Bridge & Southbank £75 - £90 £60 - £70 City £87.50 - £100 £70 - £80 King’s Cross & Euston £85 - £95 £60 - £80 Clerkenwell & Farringdon £85 - £95 £62.50 - £77.50 Shoreditch & Old Street £75 - £82.50 £55 - £70 Whitechapel & Aldgate £50 - £65 £35 - £45 Hackney & London Fields £35 - £42.50 £25 - £32.50
Stratford £45 - £55 £30 - £35 Canary Wharf £50 - £60 £35 - £45 Battersea & Nine Elms £45 - £60 £20 - £30
Camden & Kentish Town £45 - £60 £40 - £50 These costs are a guide provided by local commercial property experts and rent reports. Costs are updated each quarter, and are subject to change.
-
Contact us for more information about office rental costs in London.
-
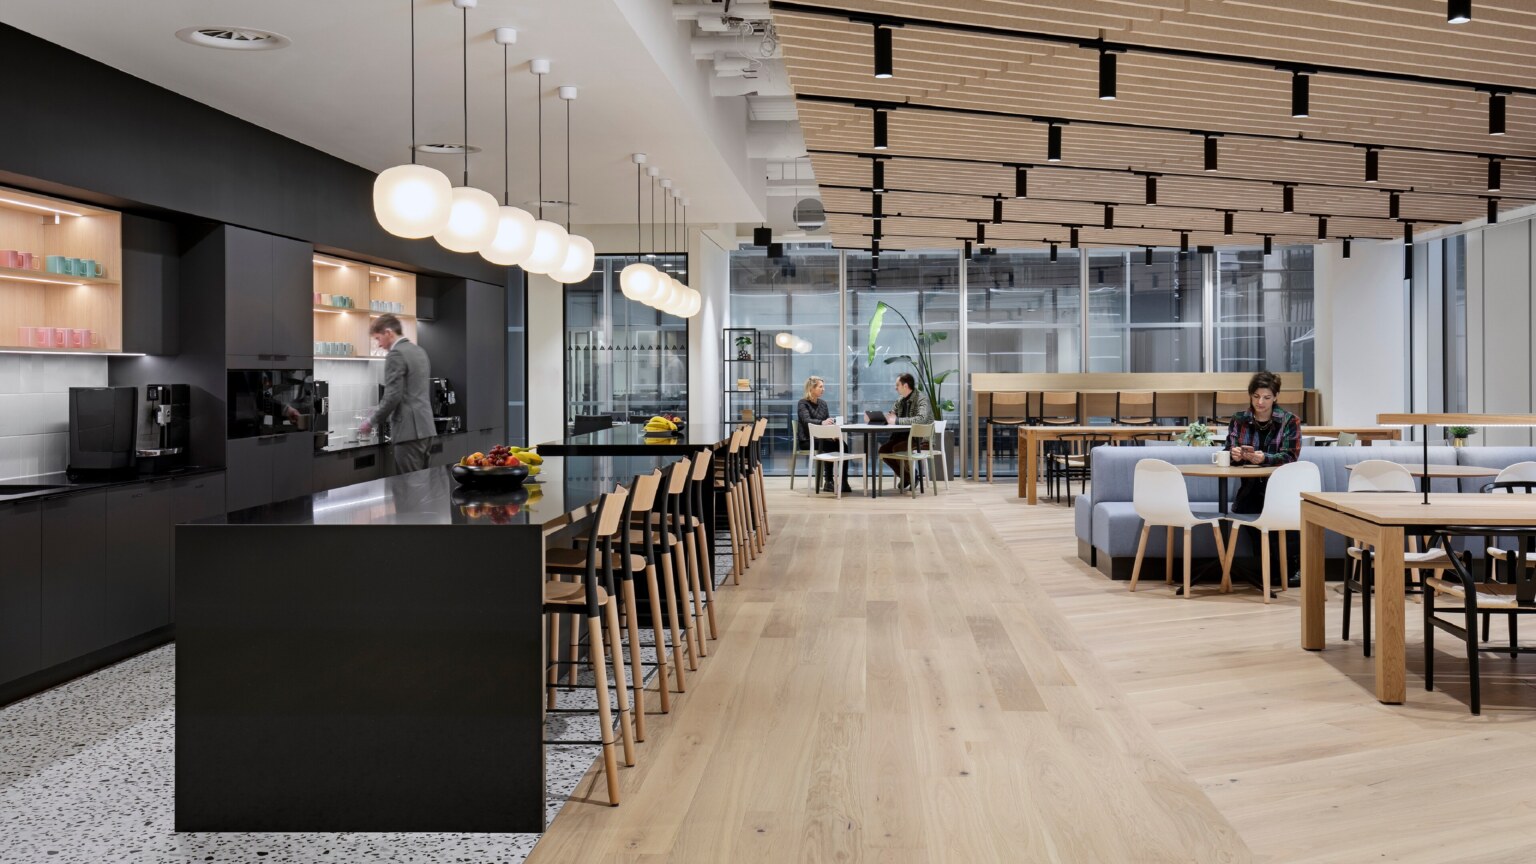
What Grade A vs Grade B space means in practice
Prime, Grade A space typically offers strong energy performance, modern amenities, generous natural light, and layouts that support hybrid working. These buildings help reduce running costs and support talent attraction. Secondary buildings (Grade B) may appear cheaper upfront but often require higher investment in fit out, upgrades or ongoing maintenance. In some cases, total occupancy cost ends up significantly higher than anticipated.
-
How much space does your business need?
Right‑sizing continues to shape property decisions. Many businesses are taking less space overall but investing more in quality, flexibility and shared environments. If you’re starting to explore your own requirements, our office space calculator is a helpful first step. This tool gives you a quick, early indication of how much space you may need before entering negotiations.
TRY OUR SPACE CALCULATOR -


-
Leasing activity across London
Leasing activity across Central London remained steady through 2025, with demand concentrated almost entirely in high-quality buildings. Q3 2025 take-up reached 2.7 million sq ft, slightly below the long-term quarterly average but strong enough to push year-to-date volumes to approximately 9 million sq ft, around 15% higher than the same point in 2024.
Vacancy sits around 8–9%, but the distribution of available space tells the real story:
- ~70% of all take-up is in Grade A stock
- 80%+ of all vacant space is Grade B, where demand remains weak
This reinforces the two-speed market, with best-in-class buildings moving quickly and older stock continuing to struggle.
-
Sector activity
The financial services sector remained the biggest driver of office demand in London during Q3 2025, accounting for an estimated 30% of total take-up. The biggest transaction in this sector saw HSBC agree a 15-year lease for 210,000 sq ft at 40 Bank Street. Elsewhere, the professional services sector was the other key player in driving take-up, with legal firm Herbert Smith Freehills Kramer’s 238,000 sq ft lease at 1 Appold Street the standout transaction.
The TMT (Technology, Media, and Telecommunications) sector also demonstrated solid activity, accounting for around 14% of leasing volume, with occupiers focusing on creative hubs such as Shoreditch, Southbank, and Farringdon. The most notable transaction was RWE Technology taking 56,418 sq ft at The Northcliffe, 28 Tudor St.
-
-
Flex operators have expanded their footprint again, growing rapidly over the past year as businesses look for more agile leasing strategies. Q3 2025 saw more than 200,000 sq ft of flexible workspace transactions, which was one of the strongest quarters since 2021. This expansion creates additional choice for occupiers but also absorbs space that might otherwise offer conventional lease opportunities.
For tenants, the takeaway is that competition for high‑quality space isn’t limited to any single sector. Activity across financial, professional and creative industries means the best buildings are moving quickly. Smaller occupiers in particular may find that acting early (or considering refurbished alternatives) opens up better options and reduces the risk of settling for compromised space.
-
-
How early should you start planning your office project?
If your lease event is on the horizon, the safest approach is to start planning well in advance. Even a small delay can affect costs, choice and the feasibility of your move. Our recent webinar on lease-end planning highlighted how early preparation protects time, budget and control – and why many teams underestimate what’s involved.
WATCH NOW -

-
What’s driving office costs in 2026?
Several forces are shaping office costs in 2026, and together they’re creating a more complex environment for occupiers to navigate. The main pressure comes from the demand for high‑quality space far exceeding supply. Grade A buildings remain limited, and the best floors are often leased before completion as businesses prioritise hybrid‑ready, amenity‑rich environments that can genuinely draw people back into the office.
Landlords are also pushing ahead with upgrades to older buildings in order to stay competitive. Even without firm EPC deadlines in place, there’s a clear expectation from occupiers around energy performance and operational efficiency. These upgrades require significant investment, and as a result, we’re seeing these costs flow through into higher rents and service charges, particularly in submarkets where older stock dominates.
-
The price of materials
Construction inflation continues to influence costs too. Material prices may have stabilised compared to the volatility of the past few years, but labour, specialist systems and high‑performance materials remain expensive.
This affects both landlords delivering new or refurbished space and tenants planning a fit out. Early design engagement can make a meaningful difference here, helping occupiers identify where value can be protected without compromising experience or long‑term performance.
-
-
Submarket preferences
Location still plays a major role in shaping cost expectations. West End markets command higher rents due to scarcity, strong connectivity and proximity to key clients and amenities. Creative fringe areas like Shoreditch, Farringdon and Old Street attract occupiers looking for character buildings and strong transport links, and refurbished stock in these neighbourhoods is performing almost as well as new builds.
Understanding the nuances between these submarkets can help businesses find better value without stepping too far outside their preferred catchment.
-
-
“Occupier expectations have evolved, and this shift has increased demand for amenities, high‑performance tech infrastructure and flexible layouts that can adapt as teams continue to refine their workplace patterns. These design considerations influence both upfront and ongoing costs, but they also have a direct impact on productivity and retention.”
Craig Smith
Chief Development Officer at Oktra
-
Taken together, these factors explain why costs continue to rise across prime submarkets. They also highlight the importance of assessing the full picture when planning your next move. A building that appears more expensive at first glance may offer better long‑term value once energy performance, fit out efficiency and employee experience are factored in.
-
Development pipeline and supply conditions
London’s development pipeline continues to tighten, and this is becoming one of the defining constraints for occupiers in 2026. Across Central London, 14 million sq ft of space is currently under construction, but only ~30% of that pipeline is genuinely available. Between 26% and 41% of all space under construction is already pre-let or under offer, depending on the submarket.
-
-
In Q3 2025 alone, around 1 million sq ft completed, bringing year-to-date deliveries to just above 4 million sq ft. Yet almost two-thirds of that space was pre-let before completion, greatly limiting open-market options.
Refurbishments now represent the bulk of development activity. Landlords are repositioning older buildings to improve environmental performance, amenity provision and workplace experience. In Southbank alone, around half a million sq ft of new or refurbished space is due to complete by the end of 2026, with a further 900,000 sq ft in the pipeline to 2029.
New construction starts, however, have slowed considerably. Higher build costs, tighter funding conditions and longer planning processes have made speculative development more difficult. Multiple forecasts now predict a structural undersupply of Grade A space from the latter half of the decade.
For occupiers, this means the window of opportunity is narrowing. With overall vacancy around 8–9%, and Grade A availability substantially lower in core submarkets, the best buildings continue to let quickly.
-
The outlook for London office space
The outlook for 2026 points to a market defined by strong demand for quality, limited supply and a growing focus on long-term value. Prime rents are expected to continue rising across core submarkets, driven by competition for best-in-class buildings and a development pipeline that remains constrained well into the decade. With a high proportion of new schemes already pre-let and refurbishment activity unable to fully close the gap, availability of Grade A space is likely to tighten further.
-
-
At the same time, occupiers are refining their workplace strategies with greater clarity. Hybrid working has matured, and most organisations now have a clearer sense of how much space they need and what that space must enable. That shift is fuelling a sustained preference for energy-efficient, amenity-rich buildings that help people collaborate, focus and feel connected when they come into the office.
Demand is also being shaped by broader corporate priorities. ESG remains a central driver of leasing decisions, even without firm regulations in place, and occupiers are increasingly scrutinising building performance, operational efficiency and the long-term cost profile of each option. Refurbished buildings that can deliver modern performance in established locations are expected to remain highly competitive.
For tenants preparing for a move, renewal or consolidation, the key themes for 2026 are clarity, timing and preparation. Early engagement offers far more control over cost, choice and design outcomes, while detailed workplace analysis helps ensure that the space you select genuinely supports productivity and culture.
In a market where quality is scarce and competition is strong, the businesses that plan ahead and make decisions grounded in evidence will be best placed to secure a workplace that delivers long-term value.
-
The London Office Rent Report
Download our report on average office rent rates for Grade A and Grade B space in London to gain a market overview and analysis of prime rent rates across London submarkets.
Find Out More -
-
For further advice on the London office market, our workplace experts can guide you through both tenant and landlord markets in greater detail.
Contact us below if you need any help or require more information on our workplace services.
-
Contact us
Get in touch to discuss your potential office space costs
020 7553 9500
info@oktra.co.uk
-
"*" indicates required fields
Related content
-
Find out more
Articles | 15 min read
-
Find out more
Articles | 14 min read
-
Find out more
Articles | 7 min read


-
Want updates on similar new content? We’ll send you an email a month with new insights when you join our mailing list.
JOIN THE LIST
